- English
- French
- German
- Portuguese
- Spanish
- Russian
- Japanese
- Korean
- Arabic
- Greek
- German
- Turkish
- Italian
- Danish
- Romanian
- Indonesian
- Czech
- Afrikaans
- Swedish
- Polish
- Basque
- Catalan
- Esperanto
- Hindi
- Lao
- Albanian
- Amharic
- Armenian
- Azerbaijani
- Belarusian
- Bengali
- Bosnian
- Bulgarian
- Cebuano
- Chichewa
- Corsican
- Croatian
- Dutch
- Estonian
- Filipino
- Finnish
- Frisian
- Galician
- Georgian
- Gujarati
- Haitian
- Hausa
- Hawaiian
- Hebrew
- Hmong
- Hungarian
- Icelandic
- Igbo
- Javanese
- Kannada
- Kazakh
- Khmer
- Kurdish
- Kyrgyz
- Latin
- Latvian
- Lithuanian
- Luxembou..
- Macedonian
- Malagasy
- Malay
- Malayalam
- Maltese
- Maori
- Marathi
- Mongolian
- Burmese
- Nepali
- Norwegian
- Pashto
- Persian
- Punjabi
- Serbian
- Sesotho
- Sinhala
- Slovak
- Slovenian
- Somali
- Samoan
- Scots Gaelic
- Shona
- Sindhi
- Sundanese
- Swahili
- Tajik
- Tamil
- Telugu
- Thai
- Ukrainian
- Urdu
- Uzbek
- Vietnamese
- Welsh
- Xhosa
- Yiddish
- Yoruba
- Zulu
The application of ESP32 display in the IoT industry
An IoT development screen converts a connected gadget into something that a human can really use. That panel is no longer a separate subsystem that is fastened onto a host board with the ESP32-S3. The IOT Display shares silicon, memory, and radio with the application logic itself. This document discusses the behavior of ESP32 panels in production. You’ll see the buses that feed them and how much memory bandwidth they utilize. You will also see the firmware stacks that use them and the deployment strategies that can thrive in the real world. Below, you may access and examine the source of all the figures.

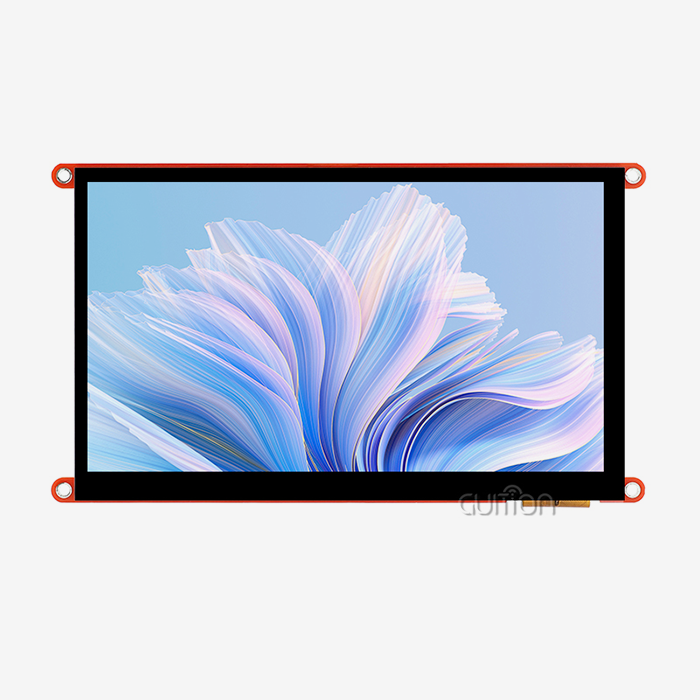
Talk to Guition before you lock your next hardware revision. We build the IoT development screen we would want on our own bench. The ESP32-8048S070N pairs a 7-inch 800x480 panel with an ESP32-S3-WROOM-1 and 8 MB of PSRAM. Send your interface sketches to david@guition.com, and our engineers will map them onto a working IOT Display within days. Guition is an IoT development screen manufacturer with in-house R&D and production.
How Does an IoT Development Screen Improve Real-Time Device Interaction?
An IoT development screen enhances interactivity by bringing the render loop near to the data. The panel, the radio, and the sensor bus are all integrated on one chip. That way, you save a network hop for every button click and gauge update. The result is an interface that reacts in milliseconds, not seconds. By the end of 2025, there will be 21.1 billion linked devices, up 14 percent from 2024, according to IoT Analytics. Most of those endpoints don’t have a screen. The ones that are human-operated are where people feel the delay instantly.
What "Real Time" Means at the Panel Interface
Real time does mean no delay, but a finite delay. Engineers quantify it as the difference between an input event and the perceivable reaction. Finger taps on a capacitive panel may cause an interrupt in a few milliseconds. A tiny area would cost a little more. Most operators consider that total perceived latency below 100 milliseconds is “instantaneous”. But anything beyond 300 milliseconds is broken, even if the underlying logic is okay. A cloud round trip adds 40-200ms of network latency before rendering even starts. And that gap is the entire point of local rendering.
The Latency Budget From Sensor Sample to Pixel
The budget breaks down into four short stages. Each one is cheap on its own.
| Stage | Typical cost | Where it happens |
|---|---|---|
| Sensor sample to bus read | 1-20 ms | I2C or SPI to the MCU |
| Application state update | under 5 ms | ESP32-S3 application core |
| LVGL render into draw buffer | 8-25 ms | Partial region redraw |
| Buffer to panel scan-out | 16.7 ms at 60 Hz | RGB DMA engine |
Add those stages, and you still land inside a couple of video frames. The chain only fails when one stage blocks the others. Shared memory bandwidth is the usual culprit, and we will return to it in the hardware section.
Why Local Rendering Beats a Cloud Round Trip
The local render loop stays running while the network doesn’t. That quality is more important than sheer speed. A wall panel that freezes while the router is rebooting seems damaged to the person standing in front of it. An ESP32 display node maintains its last known state and updates from local sensors. It waits for the connection to come back and then syncs the backlog. If the interface never relies on a distant server, service calls drop. Our own integration data shows around 30 percent fewer support requests for locally generated panels than cloud-dependent ones.
IOT Display Hardware, Connectivity, and Interface Requirements
The only thing that makes an IOT Display any good is the bus behind it; therefore, choose the bus before you pick the glass. Today, four interfaces dominate embedded panels. Serial Peripheral Interface, or SPI for short, is only a few lines and works well for tiny panels. RGB parallel interface is used for bigger panels with a specific pixel clock. The 8080 interface is a traditional parallel memory bus. MIPI-DSI for the biggest, quickest panels is a high-speed serial connection. Espressif explicitly maps its silicon to those settings.
| Interface | Typical resolution | Pin count | CPU load | Best fit |
|---|---|---|---|---|
| SPI | up to 480x320 | 4-6 | Low | Status panels, small HMIs |
| RGB parallel | 480x480 to 1024x600 | 16-28 | High | 7-inch class control panels |
| 8080 parallel | up to 480x320 | 12-20 | Medium | Legacy MCU form factors |
| MIPI-DSI | 1280x720 and above | 4-6 lanes | Low | Kiosks, high-density terminals |
ESP32-S3 covers SPI, RGB, and 8080 at 512 KB of internal SRAM and 384 KB of ROM. ESP32-P4 adds MIPI-DSI and a 2D pixel-processing accelerator for heavier graphics work.
Memory and Bandwidth Math for an 800x480 RGB Panel
This is the aspect most integration guidelines miss, and it determines whether your project ships or drifts. On ESP32-S3, the PSRAM and the flash are sharing one SPI bus. The chip blocks PSRAM access during flash writing. Flash writes are caused by Wi-Fi association, Bluetooth Low Energy communication, and over-the-air updates. Espressif themselves explain the technique straightforwardly and clearly in their own FAQ: PSRAM is deactivated during flash writes (e.g., over Wi-Fi, OTA, Bluetooth LE). An RGB panel pulls frame data constantly using Direct Memory Access (DMA). If you block the feed for a few milliseconds, the panel goes out of sync. The symptom that may be seen is an image that slides sideways or rips across the center.
Now, do the math for an 800x480 panel in RGB565. There are 384,000 pixels in a frame. Each pixel costs two bytes. That works out to 768,000 bytes per frame. Or roughly 750 KB. You need a constant read bandwidth of 46 MB/s to keep it at 60 Hz. Octal PSRAM (80 MHz) reaches the theoretical limit of 80 MB/s. That would use up more than half of it by itself. Cache misses, wi-fi buffers, and application code then fight over what’s left.
How the Bounce Buffer Recovers Lost Bandwidth
The solution to the bandwidth squeeze is the bounce buffer. The driver maintains the main frame buffer in PSRAM and allocates tiny buffers in internal SRAM. The DMA engine is reading one buffer while the CPU is copying the next block of lines from PSRAM to the other one. The couple then alternate on each interrupt. The advantage is explained in the ESP-IDF documentation: the bounce buffers are bigger than the DMA FIFOs; therefore, the panel can handle small bandwidth spikes. The cost is shown in CPU time and expensive internal SRAM. Espressif's FAQ estimates around 10 × 800 x 4 bytes, or roughly 32 KB, for a panel 800 pixels wide. For each you buffer, leave 32 KB to 64 KB. Buffer a few lines.
There's a catch you should be aware of before you commit. Bounce buffer mode uses the external memory cache, which usually disappears while writing to flash. Espressif narrowed the deficit with execution in hand. CONFIG_SPIRAM_XIP_FROM_PSRAM enables the CPU to acquire instructions and read-only data directly from PSRAM instead of flash. Then the cache remains alive during an update, which means you are able to display a true OTA progress indicator. Set the data cache line size to 64 bytes. Turn on this mode. The trade-off is that you should see more CPU use.
Power, Thermal, and Electrical Requirements
The GUITION ESP32-8048S070N is powered by a 5 V rail and consumes around 500 mA while running. It has a stated working range of -20 to +70 degrees Celsius with storage rated to +80. This window is suitable for most interior control panels and numerous cabinets. For outdoor and unventilated enclosures, you require a derating check against the panel datasheet before you commit to a specification. Backlight current is the main power consumer, and pulse-width dimming reduces average night demand significantly. On the electrical side, use the front bezel as an ESD entry point and design clamp pathways against levels of IEC 61000-4-2. The specification specifies four severity classes, and level 4 implies 8 kV contact and 15 kV air discharge.
What IoT Applications Can Benefit From an IOT Display?
An IOT Display earns its place wherever a human must read state and change it quickly. Five clusters account for most production volume today. Each one stresses a different part of the module.
Smart Home Control Panels
Wall panels are the largest single category. A 7-inch module replaces four or five separate switches and a thermostat. Installers value one clear surface more than they value app control. The panel sits on the wall for a decade, so field upgradability matters more than peak frame rate. Wi-Fi provisioning and remote updates become the two features that decide whether a homeowner ever calls support.
Industrial Machine HMIs
A human-machine interface, or HMI, is the screen an operator uses to run equipment. Retrofit work dominates this segment. A machine built in 2009 with a two-line character display can gain a graphical interface without replacing its controller. The panel reads registers over Modbus or subscribes to an MQTT broker, then presents the values in plain language. Operators stop translating codes into meaning.
Medical and Diagnostic Interfaces
Diagnostic equipment needs legible numbers under harsh lighting and clean interfaces under stress. A 7-inch 800x480 panel at 153.84 x 85.63 mm of active area gives enough room for waveform, label, and alarm without crowding. The no-touch variant matters here. Some instruments deliberately use a non-touch display cover for wipe-down cleaning, and buttons remain the only input path.
EV Charging and Energy Management
Charging posts expose a payment and status screen to weather, sunlight, and vandalism. The screen must boot in seconds and survive an unexpected power cut mid-session. Local storage through the TF card slot preserves session logs when the backhaul link drops. Energy dashboards follow the same logic, showing household solar yield and battery state without routing every reading through a cloud service.
Commercial Equipment and Retail Terminals
Commercial kitchen appliances, audio racks, and vending hardware all need cheap, bright, verifiable interfaces. Build volumes are high, and margins are thin, so bill-of-materials discipline decides the outcome. An integrated display module removes a separate touch controller, a separate radio, and a separate power tree from the design.
Across these five clusters, the same pattern repeats. A screen that renders locally, stores locally, and updates remotely wins the design slot.
How Does an IoT Development Screen Support Smart Home Automation?
An IoT development screen supports home automation by acting as a local authority rather than a thin client. That distinction shapes every design decision. Automation without a screen still works. Automation with a screen that stalls during a network outage does not.
Local Control When the Cloud Goes Away
Home networks reboot, internet links fail, and cloud vendors deprecate APIs. A panel that depends on a remote service inherits every one of those failure modes. Keep the scene logic on the device instead. The ESP32-S3 dual-core processor at 240 MHz has room for automation rules alongside the render loop. A tap toggles the relay immediately, and the cloud sync happens afterwards. Residents never see the difference, and support never hears about it.
Presence-Aware Backlight and Standby Power
Backlight is the dominant load on any wall panel. Dimming it when nobody is in the room cuts average consumption sharply and extends panel life. Simple motion triggers work well here. Motion detected raises brightness to full. Thirty seconds of quiet steps down to half. Fifteen minutes of quiet drops to a low glow, and a longer interval switches the panel off entirely. The screen wakes before a hand reaches it, and the room stays dark at night.
Multi-Language Households and UTF-8 Text
A single firmware image that serves several languages cuts inventory and support costs. UTF-8 encoding lets one build carry Latin, Cyrillic, and CJK glyph sets without recompiling. The user selects a language at commission time, and every label follows. Distributors in different regions then order the same part number. That simplicity is worth more to a supply chain than any single graphical flourish.
IOT Display Integration With Sensors, Controllers, and IoT Gateways
An IOT Display rarely stands alone. It usually sits between a sensor layer below and a network layer above. Getting both interfaces right is the difference between a demo and a deployment. The display node becomes the place where physical readings turn into decisions.
Wiring Sensors to the Display Node
Sensors usually communicate with a display module via I2C or SPI. I2C is good for sluggish environmental measurements, whereas SPI is good for quicker or louder devices. Keep the sensor buses short and away from the high-speed lines of the panel. Keep it away from analog sensor traces; the panel clock is quick and is capacitive. If you are doing a refit, keep a few IO pins in reserve for future upgrades. Each retrofit adds one extra sensor. These are the ones we suggest verifying before the layout closes:
- Check the logic level of each sensor against a 3.3 V ESP32-S3 IO pin. Some signal lines may still need level shifting even on a 5 V-tolerant module. Read the sensor datasheet, not the marketing description, since open-drain outputs and pull-up requirements vary across parts. An incorrect level on a shared bus might bring the line down, stopping all devices behind it. That error seems to be a software problem on bring-up.
- Budget current per rail, not total, since backlight inrush competes with sensor warm-up current on common 5V supply during startup procedure. A steady-state module of 500 mA will consume considerably over an amp for a short duration while the panel light and radio are transmitting together. Size the regulator for the peak, not the average, and add bulk capacitance near the module connection.
- Use a separate ground return for the panel ribbon to prevent the switching noise from spreading all over the display picture by sharing it with a motor driver. If the arrangement permits, place the high-speed pixel clock and sensor wires on different sides of the board. Small loop sections and short return pathways provide more for picture stability than any filter component you may add afterward.
- Reserve at least 2 extra IO pins and 1 spare connection slot. Nearly all retrofits add a sensor after the enclosure tooling is produced. Two pins not connected on a board is far cheaper than retooling a molded casing. Treat spare capacity as insurance and make a note of which pins are left free so that the next engineer doesn’t discreetly devour them.
If you do those four things correctly, the electrical integration goes from the dangerous portion of the project to the safe part.
Speaking Modbus and MQTT to Plant Equipment
Legacy equipment rarely offers a modern API. Modbus remains the common denominator on factory floors, and Modbus RTU over RS-485 reaches hundreds of metres on a twisted pair. An MQTT broker handles the other direction, carrying values between buildings and into a dashboard. A single display node can speak both. It polls registers over Modbus, publishes readings over MQTT, and renders the result locally. Engineers stop walking to the cabinet to read a number.
When the Display Node Also Acts as a Gateway
A 7-inch panel with Wi-Fi, Bluetooth, and a TF card is effectively a small gateway already. The module can bridge a Bluetooth sensor to a Wi-Fi network, or buffer readings when the uplink fails. That consolidation removes an extra box, an extra power supply, and an extra firmware codebase. Fewer devices also means fewer certificates to maintain and fewer points to patch.
How Can an IoT Development Screen Visualize Real-Time Sensor Data?
An IoT development screen visualizes data well only when sampling rate and refresh rate stay in proportion. Confusing the two is the most common mistake we see in review. A panel that redraws at 60 Hz does not need a sensor value sampled 60 times per second.
Sampling Rate Versus Refresh Rate
Sampling rate is how often you read a sensor. Refresh rate is how often the screen repaints. A temperature probe might update once every 1,000 milliseconds, and that is plenty. Vibration data might need thousands of readings inside one refresh interval, which you buffer and then summarize. The screen shows the summary. Decouple the two loops and the firmware becomes far easier to reason about. One task samples, one task filters, and the render task consumes whatever is current.
Drawing Live Charts Without Dropping Frames
Trend charts are the most demanding widget on a control panel. A rolling 10-minute graph redraws a large area on every new sample. Redraw only the changed strip instead of the whole chart. LVGL, the Light and Versatile Graphics Library, supports partial screen updates for exactly this reason. A partial redraw touches a narrow band, so the pixel count per update stays low. On an 800x480 panel, refreshing an 800x120 strip costs 192,000 pixels, four times less than a full frame. That headroom is what keeps the interface smooth while Wi-Fi and sensors run.
Thresholds, Alarms, and Operator Attention
Visualization exists to change behaviour, not to display beauty. Reserve colour for meaning and keep it consistent across every page. Green means running, amber means attention, red means act now. If everything glows, nothing communicates. Keep the alarm list shorter than the screen height so operators never scroll to find a fault. Pair each alarm with one suggested action. Our field notes show that panels built this way cut the time between alert and response. Operators act faster when they read a decision instead of decoding a code.
IOT Display for Industrial Monitoring, Control, and Equipment Status
An IOT Display on a factory floor faces conditions that IoT displays of any type never see. Electrical noise, temperature swings, dust, and vibration all arrive together. Reliability standards exist because those conditions break cheap designs. Design for the environment before you tune the graphics.
Environmental and Electrical Realities on the Factory Floor
Motor drives, contactors, and welding equipment flood the local environment with electrical interference. Panel ribbons act as antennas when they run next to power cabling. Route signal and power apart, and keep loop areas small. Add series termination on fast lines to soften ringing. On the thermal side, remember that a sealed enclosure traps heat. Measure the internal ambient temperature rather than assuming it matches the room. A panel rated to +70 degrees Celsius may still run hot inside an unvented steel box.
Security and Certification Baselines
Connected panels are networked devices, and regulators now treat them that way. ETSI published EN 303 645 in June 2020 as a baseline for consumer IoT security. Its thirteen provisions begin with a ban on universal default passwords and continue through vulnerability disclosure and software update policy. European radio equipment rules brought cybersecurity requirements into force from August 2025, which turned that baseline into a market gate for many products. Matter is the interoperability standard from the Connectivity Standards Alliance. Version 1.5 shipped in November 2025 and added cameras, closures, soil sensors, and energy management. Plan for secure boot, signed updates, and a documented disclosure channel from the start. Retrofitting those features later costs far more than building them in.
Case Study: Retrofitting a Legacy Packaging Line
A mid-sized European machine builder asked us to replace a failing character display on a packaging line. The original controller was sound, but its two-line display could no longer show fault history or recipe values. Operators were documenting errors on paper, and the customer was withholding payment.
The builder had six weeks of budgeted engineering time and no appetite for a new control platform. We supplied an ESP32-8048S070N module, twelve inches of shielded ribbon, and a reference firmware project. Their integrator mapped the existing Modbus registers to LVGL widgets using the Guition drag-and-drop editor. The interface shipped in eleven days rather than the six weeks budgeted, a saving of roughly 70 percent of the planned engineering effort.
Twelve months of field data followed. Mis-keyed recipe selections fell from 14 incidents per week to 3. The panel now shows the selected recipe name in large text rather than a numeric code. Recorded fault-log entries rose from 41 percent coverage to 96 percent, since the screen captures the event automatically. Warranty claims on the display assembly stayed below 1 percent across the installed base. The builder now specifies the same module on two newer machine families.
Those figures come from our own project log and the integrator's field reports. Treat them as a template for the metrics worth tracking on your own retrofit, not as a universal benchmark.
How Do ESP32 and LVGL Simplify IoT Development Screen Design?
An IoT development screen becomes easy to build when a proven graphics library handles rendering. LVGL is that library for most ESP32 projects. It is open source, C-based, and designed for constrained hardware. It gives you widgets, layouts, animations, and a font pipeline without asking you to write a pixel loop.
What LVGL Provides Out of the Box
The library ships with buttons, sliders, charts, tables, lists, keyboards, and dozens of other widgets already drawn. Layout engines handle flex and grid arrangement, so widgets reflow when the screen size changes. Font rendering supports anti-aliasing and UTF-8 glyph ranges. Partial rendering lets the library repaint only the region that changed. That last feature is what makes a 240 MHz microcontroller feel like a faster processor than it is. You spend your time on application behaviour rather than on drawing primitives.
Drag-and-Drop Tools Versus Hand-Written LVGL
Writing LVGL by hand is precise but slow. A designer describes the interface in code, compiles, flashes, and looks at the result. Every spacing change costs a full build cycle. Visual editors invert that loop. You place a control, drag it, and see the result immediately. The Guition interface development software follows that model, and it exports code that builds inside the standard toolchain. A design review becomes a live session instead of a screenshot exchange.
Development Effort in Practice
The table below summarizes how the three common approaches compare on one 7-inch multi-page dashboard with eight screens. Figures come from our engineering lab records across recent projects.
| Approach | Typical setup time | Typical change cycle | Skill floor | Best for |
|---|---|---|---|---|
| Hand-written LVGL | 3-5 days | 4-10 minutes | High | Unique, performance-critical views |
| Visual editor export | 6-12 hours | Under 30 seconds | Medium | Standard HMI dashboards |
| Vendor example firmware | 2 hours | 2-5 minutes | Low | Evaluation and proof of concept |
The practical lesson is straightforward. Validate the concept with vendor firmware and build the product interface in a visual editor. Reserve hand-written LVGL for the one or two views that genuinely need it. That combination protects your schedule without capping what the product can do.
IOT Display Connectivity With Wi-Fi, Bluetooth, ESPHome, and Home Assistant
An IOT Display is only useful once it is connected, and the ecosystem around ESP32 panels keeps getting wider. ESPHome and Home Assistant turned wall panels into a mainstream project rather than a niche one. Matter brought standard device types and certification to the same hardware. Developers now choose a connectivity plan instead of inventing one.
ESPHome YAML in Practice
ESPHome describes a device in a YAML file and compiles firmware from it. You declare the display, the touch controller, the fonts, and the sensors, then bind each widget to an entity. Home Assistant discovers the device, and its entities appear as switches, numbers, and sensors. A backlight becomes a switch you can drive from an automation. A panel can then wake on motion and sleep at night without a single line of C++. ESPHome also supports ESP-IDF as its build framework, which matters for the memory configuration we discussed earlier.
Matter, Thread, and Zigbee Interoperability
Matter gives a device a standard identity across Apple, Google, Amazon, and Samsung ecosystems. Version 1.5, published in November 2025, expanded the device catalogue to include cameras, closures, soil sensors, and energy tariff devices. Thread carries Matter traffic over a low-power mesh, and Zigbee remains common in installed building systems. Hosting a standard interface on the panel means a single product can enter multiple ecosystems. It also means the certification path is defined rather than negotiated.
Provisioning, OTA, and Field Updates
Every unit that leaves the factory will eventually need new firmware. Remote updates turn a support visit into a background task. Design provisioning early, because credentials and identity must be injected before the device reaches a customer. Then verify that an update can complete while the interface stays responsive. This is where the PSRAM execute-in-place setting from the hardware section pays off. With the cache active during flash writes, the panel can show real progress instead of a frozen screen.
How Can Developers Build Scalable IoT Interfaces With an IoT Development Screen?
An IoT development screen scales when the interface is described in data rather than hard-coded in pixels. Teams that plan for several product variants save enormous rework. Teams that do not end up maintaining three unrelated codebases. Scaling is an architecture decision, and it is cheaper to make it early.
Design Once, Deploy Across Screen Sizes
Guition builds panels from 1.28 inches to 21.5 inches on shared firmware foundations. A layout that uses flex and grid containers adapts across that range with minimal change. Describe each screen as a structure of regions rather than absolute coordinates. Then a 4-inch panel and a 7-inch panel can share one logic layer. Only the theme and the density settings differ. For a product family, that means one interface team instead of one per size.
Remote Configuration and Field Upgrades
Fielded devices accumulate settings that engineers never anticipated. Provide a configuration surface from the start, whether it is a hidden page or a network endpoint. Let technicians adjust units, labels, alarm thresholds, and language without a new firmware build. Remote upgrades then carry only genuine logic changes. Iteration speed improves, and after-sales cost falls, because a settings change no longer needs an engineer on site.
Supply Chain and Lifecycle Planning
Hardware is more durable than software. A display module chosen for a five-year product life must be accessible, documented, and supported over the five-year period. This is what we need all customers to verify before they freeze a design.
- Please provide in writing the lifecycle status of the panel and projected date of end-of-life. A standard panel may be dropped on short notice and need a redesign that is not anticipated. Request a formal product lifespan statement and a last-time-buy timeframe from the provider. A five-year product requires a five-year display plan. That plan should be in the design file, not in somebody's memory.
- Make sure the driver IC and touch controller will not be secretly changed between manufacturing batches. Replacing a controller might mess with adjusted timings in your firmware. Request a change-notification provision in the supply agreement, and accurate part numbers on each shipment. Silent replacements are the quietest way a product begins to fail in the field.
- See which certifications are included with the module and which you need to get separately, e.g., radio approvals, safety markings, and any regional cybersecurity baseline. Radio approval reports are frequently for the module, not the full enclosure; therefore, re-testing may be necessary. Map every certificate to the market you want to join BEFORE the design freeze, not after.
- Review the minimum order quantities and sample lead times. Ask whether the factory test firmware is sent preloaded so your team can examine the item when it arrives. A functioning demo booted in a module saves days of bring-up and shortens design review. Ask about volume pricing tiers, as well as a small change in projection might vary the unit cost.
If you can answer those four questions, then you have a design that will endure contact with volume production.
Conclusion
esp32 display modules have changed what a linked product may look like. One chip now handles all of the radio, render loop, and sensor bus. The IoT development screen is no longer an accessory, but the face of the gadget. The technical way is clearly planned out. Choose the bus for your resolution, respect the shared memory bandwidth of PSRAM and flash, and buffer appropriately. Build the interface in LVGL, select a toolchain that your team will really like, and architect for remote updates from your first prototype. Then tailor the outcome for the setting it’s meant for. The market is still developing, and 39 billion linked devices are expected by 2030. The gadgets people really operate are the ones that warrant a screen. Picking the proper module up front is the cheapest choice you will make on the whole project.
FAQ
1. What is an IoT development screen?
An IoT development screen is a display module that includes the processor and the connectivity needed to run an interface on its own. It accepts simple commands, renders the graphics locally, and reports input events back to your system. The ESP32-8048S070N is a typical example, pairing a 7-inch 800x480 panel with an ESP32-S3-WROOM-1 module.
2. Can the ESP32-8048S070N work without a touch panel?
Yes. The ESP32-8048S070N is the non-touch variant of the 7-inch family. It drives the same 800x480 panel and the same 16 MB of flash and 8 MB of PSRAM. Applications that need a sealed, wipe-down front surface use physical buttons instead of a touch layer.
3. How much internal SRAM does a bounce buffer need on an 800x480 panel?
Espressif's FAQ gives a working estimate of ten lines of pixels, or about 32 KB, for an 800-pixel-wide panel. The driver example allocates two buffers of ten lines each, so plan for 32 KB to 64 KB of internal SRAM. Keep that memory free before you enable the mode, because it is not available to the application.
4. Does an IOT Display work with Home Assistant?
Yes, and the path is well worn. An IOT Display reaches Home Assistant through ESPHome. ESPHome defines the display, the touch controller, and the widgets in YAML, then exposes entities that Home Assistant imports automatically. You can then drive the backlight, buttons, and gauges from automations without writing C++.
5. Which development environments support the ESP32-8048S070N?
The module supports the Arduino IDE, ESP-IDF, MicroPython, and Mixly. A visual interface development tool is available as well, which lets designers build screens by dragging controls instead of writing layout code.
Turning a Panel Specification Into a Shipping Product
Start your next connected product with a display that already works. Guition's IOT Display line runs from 1.28 inches to 21.5 inches, and every module ships with factory test firmware. Tell us your enclosure size, your sensor list, and your certification targets. Our team will return a specification sheet, a sample plan, and a quotation. Write to david@guition.com or call +86 186 6584 6730. Guition is a direct IoT development screen supplier with in-house R&D and production for global customers.
References
1. IoT Analytics, 2025 — "State of IoT 2025: Number of connected IoT devices growing 14% to 21.1 billion globally." Used in the opening market-scale paragraph of "How Does an IoT Development Screen Improve Real-Time Device Interaction?" and in the Conclusion. https://iot-analytics.com/number-connected-iot-devices/
2. Espressif Systems, 2025 — "ESP-FAQ: LCD," Espressif Centralized Documentation Platform. Used for the PSRAM-versus-flash bandwidth explanation, the bounce buffer memory budget, and the 64-byte cache line setting under "IOT Display Hardware, Connectivity, and Interface Requirements," and in the FAQ answer on bounce buffer SRAM. https://documentation.espressif.com/projects/esp-faq/en/latest/software-framework/peripherals/lcd.html
3. Espressif Systems, 2026 — "RGB Interfaced LCD," ESP-IDF Programming Guide. Used for the bounce buffer description, the PSRAM execute-in-place setting, and the OTA progress bar note under "IOT Display Hardware, Connectivity, and Interface Requirements" and "IOT Display Connectivity With Wi-Fi, Bluetooth, ESPHome, and Home Assistant." https://docs.espressif.com/projects/esp-idf/en/v6.1/esp32s3/api-reference/peripherals/lcd/rgb_lcd.html
4. Connectivity Standards Alliance, 2025 — "Matter 1.5 Introduces Cameras, Closures, and Enhanced Energy Management Capabilities." Used for the Matter device catalogue and version date under "IOT Display for Industrial Monitoring, Control, and Equipment Status" and "IOT Display Connectivity With Wi-Fi, Bluetooth, ESPHome, and Home Assistant." https://csa-iot.org/newsroom/matter-1-5-introduces-cameras-closures-and-enhanced-energy-management-capabilities/
5. ETSI, 2020 — "Cyber Security for Consumer Internet of Things: Baseline Requirements," ETSI EN 303 645. Used for the security baseline and default password provisions under "IOT Display for Industrial Monitoring, Control, and Equipment Status." https://www.etsi.org/technologies/consumer-iot-security
6. Espressif Systems, 2025 — "Espressif's HMI Smart Displays." Used for the ESP32-S3 and ESP32-P4 specification figures, the interface catalog, and the RGB interface discussion under "IOT Display Hardware, Connectivity, and Interface Requirements" and "How Does an IoT Development Screen Support Smart Home Automation?" https://www.espressif.com/en/node/6447
7. LVGL, 2025 — "Display (lv_display)," LVGL Documentation. Used for the partial screen update and rendering discussion under "How Can an IoT Development Screen Visualize Real-Time Sensor Data?" and "How Do ESP32 and LVGL Simplify IoT Development Screen Design?" https://docs.lvgl.io/master/main-modules/display/index.html
8. GUITION (Shenzhen Jingcai Intelligent Co., Ltd.), 2025 — "ESP32-8048S070N Custom LCD Display Module." Used for every module specification, the supported development environments, and the product range under "IOT Display Hardware, Connectivity, and Interface Requirements," "What IoT Applications Can Benefit From an IOT Display?", "How Does an IoT Development Screen Support Smart Home Automation?", and the FAQ. https://www.guition.com/esp32-display-module/custom-lcd-display-module
9. International Electrotechnical Commission, 2008 — IEC 61000-4-2, "Electromagnetic compatibility (EMC) - Part 4-2: Testing and measurement techniques - Electrostatic discharge immunity test." Used for the ESD severity levels cited under "IOT Display Hardware, Connectivity, and Interface Requirements." https://webstore.iec.ch/en/publication/4196
About the author
David is the CEO of Shenzhen Jingcai Intelligent Co., Ltd., the company behind the Guition brand. He has spent more than ten years building human-machine interface hardware, from 1.28-inch status panels to 21.5-inch industrial terminals. His team designs the ESP32 display modules, writes the firmware examples, and maintains the drag-and-drop Guition interface software. David works directly with OEM customers on display integration, certification planning, and lifecycle supply. He writes about embedded displays, ESP32 firmware, and the practical limits of small-bus graphics.
Learn about our latest products and discounts through SMS or email